W25_HI_Lesson Learned from Garuda AACE 2015 Class


  1. Problem Definition

Our Garuda AACE 2015 Class is about to finish. This blog is to present any feedback during the class that can be useful lesson learned for the next class(es).

  1. Development of Feasible Alternatives

The main topics for this lesson learned which discussed here are :

  • What would I do DIFFERENTLY if I had to take this course over again
  • What tool/technique did I actually implement at work to help me generate a favorable Return on Training Investment (RoTI)
  • What advice would I give to others who are going to take this course in the future


  1. Development of the Outcomes for Alternative

For first question “What would I do DIFFERENTLY if I had to take this course over again”, I have several ideas :

  1. To be able to adapt fast and make a good planning, I will read carefully lesson learned from previous classes and learned from them to make my course run easier.
  2. To be able to speed up on tasks given by the Client, especially blog and paper project, I will make contact directly to the outstanding performer from previous classes. Choose 2-3 good performers from them, especially who has time availability to support me as the Subject Matter Experts.
  3. To be able to manage the team in good form, I will remind the team how important that we choose the right person to manage the team. The person who has more time and focus to bring the team to be still on the track.

I did not do those above on my current course. For the first two items above, if I had to take this course over again, I will do them, especially to help me with paper project since I was so slow on that project , therefore I failed to finish it within the given timeframe. Start from W1, focus on this task. Try to finish it within the timeline, and do not ever slip from the schedule. Great advantage if I can pick the paper topic at the first Face to Face session so it can be discussed properly to avoid delay in writing the paper.

For second question, “What tool/technique did I actually implement at work to help me generate a favorable Return on Training Investment (RoTI)”, I have several example of tools/technique below which very useful on my daily job :

  • Cost Estimate Relationship (my W2 Blog).

This was very useful when my team at work did the pre-FEED cost estimate.

  • Multi-attributes Decision Making (my W3 Blog)

This was useful when evaluated vendor quotation.

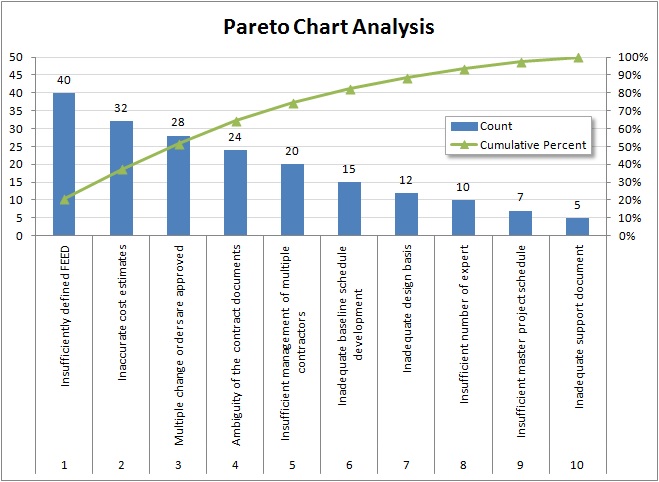
  • Pareto Chart (my W4 blog)

This was useful when deal with various problem items and I need to focus on the significant problems due to the time constraint.

  • WACC, Life Cycle Cost Analysis, and MARR (my W5-W7 Blog).

After learned all of them, I have confidence when I had discussion with the Economist at  my work, especially WACC and MARR topics. I can contribute my idea since I had ground understanding with them, compare to the time before I took the course.

  • Other such Earned Value, Force Field Analysis, Depreciation, IRR & ERR, POT, Rebaseline, etc, had provided me with a lot of techniques to complete my tasks at work

For the third question “What advice would I give to others who are going to take this course in the future”, several suggestions as per below :

  • Commitment and Teamwork

Everyone should commit to every task and realize that to be able to survive we need a good teamwork. One should not be a burden to others. So plan and do this, not as an under performer.

  • Plan well and use the time wisely.

We need to make a good plan of what target that we should complete each week. Be discipline and use the allocation time wisely. Once you loss the time, and out from the track (and if continuously happen), it will be very difficult to do the recovery.

  • Prepare for the unexpected and take step more advance

Even if you have produced a good planning, there will be high possibility you will face the unexpected problem which will draw your time and focus out from the course, for example you get sick, your child get sick, very high load at work, etc. So it is very recommended that you take extra step in advance , or in other words make your progress advance than the plan. Create this buffer, especially in the early weeks of the course on blog and paper tasks. When the unexpected come and you do not have enough time to do the task, just release your buffer.

  • Work smart, not hard.

As the mentor’s advice, “ Do not re-invented the wheel”. If you could link the topic of the blog, paper, and problem solving, and with the Client agreement, you can claim for multi progress in the same time of task. Refer to the other blog is not prohibited , however please respect the original author by put related link in the citation.

Below are the useful link for the information as mention above:

  1. PM World Journal         : http://pmworldjournal.net/
  2. AACE                                 : http://www.aacei.org/
  3. 2012 Class                         : https://aacecasablanca.wordpress.com/
  4. 2013 Class                         : https://mercureaace2013.wordpress.com/
  5. 2014 Class                         : https://kristalaace2014.wordpress.com/
  6. 2015 Class                        : https://garudaaace2015.wordpress.com/
  7. Citefast                             : http://www.citefast.com/
  1. Selection of the Acceptable Criteria

Any useful lesson learned above description can be utilized to get success on this course.

  1. Analysis and Comparison of the Alternatives

All the lesson learned above can be utilize to improve not only for this class team member but also for the next class in order to gain success to achieve the objective of the course.

  1. Selection of the Preferred Alternative

We can use all the lesson learned above on future classes to be well prepared prior the class start.

  1. Performance Monitoring and Post-Evaluation of Results

It is important to the person who take this course to be pro-active and try to implement the tools and technique in daily works for improvement so we can achieve the prime goals which are to pass one of the AACE certification at the 1st attempt and for Return on Training Investment (RoTI). Best luck with your upcoming class.

Reference:

  1. AACE International – Professional Resources – Recommended Practices. (2014, August 23). Retrieved from http://www.aacei.org/resources/rp/
  2. Project Management World Journal — A Global Resource for Continuous Learning in Program and Project Management. (2014, August 23). Retrieved from http://pmworldjournal.net/
  3. Darwito, R. (2015). W25_RD_Lesson Learned (Garuda AACE 2015 Class). Retrieved from https://garudaaace2015.wordpress.com/2015/08/21/w25_rd_lesson-learned-garuda-aace-2015-class/
  4. Citefast automatically formats citations: APA 6th edition, MLA 7th ed. and Chicago 16th ed. (2014, August 23). Retrieved from http://www.citefast.com/
Posted in Tak Berkategori | 1 Comment

W25_EY_Garuda 2015 Class Lesson Learned


  1. Problem Definition

At the end of last blog posting for Garuda AACE 2015 Class, even the project was delivered in the optimum time frame, there are still have a lot of lesson learned that need to consider from which we can learn. One of the improvement cost-effective project management tool is lesson learned and hopefully it can be useful to consider on next class.

  1. Identify the Feasible Alternative
  • Lesson learned before joining the course
  • Lesson learned during the course
  • Lesson learned at the end of course


  1. Development of the Outcome for Alternative

This course is Advanced Integrated Asset, Portfolio, Program and Project Management which consist of two main objective:

  • For the Company or Organization: To generate return on training investment which will help the student to develop the soft skill and implement in the real work environment.
  • To help the student to prepare for AACEI certification, PMI or INCOSE certification.

Lesson learned before joining the course.

  • This course program will be at 25 weeks program, so before to join the class it required the strong commitment and self-discipline and need to planning your activity to achieve this target. It strongly recommended to get some information from previous successful class, what need to do and to plan in the course period and what is the problem will appear as this program will run by the entire class as one team.
  • Check the previous project team blog posted and get an idea what is the topic you will run in your course


 Lesson learned during the course.

This course program will run into 3 phase which is

  • Five days Face to face session,

In this session the trainer will guide you what is the program will be implementing, the objective of the course and what the expectation to achieve it and the tools will be use. In this session will be setup the project for distance learning program. You need to elaborate will all the team member and select the program manager to manage the project. This is the starting point where the success of your project and program it really depend on this setup.

  • Long distance learning method

In this period you will run the project as what you setup in the face to face session. The project consist of :

  1. Project control which is each of the member will be submit weekly report of the personal program to measure the performance.
  2. 2500 word paper, this is the mandatory if you select CCP certification as the first choice.
  3. Blog posting, this will be the weekly project which at least you need to submit 1 blog for every week, commonly it about 25 blog need to post during the distance learning program
  4. Problem solving from engineering economic book and Project Management Using Earned Value book as the primary book reference
  5. Mid Test, this is to review your performance as the benchmark indicator
  6. Mapping Tools and Technique, this is to mapping tools and technique to all the reference given in the class as the reference.

To run all above project, you need strong commitment. In here you really need to plan what to do and need to do what you plan. If you not commit you will ruin you project and potential you will redo you program in the next class. Based on the class experiences, the communication along with the team member is very important and always raise the question when you need to understand something with your project to your team or to the trainer for the solution. The English writing skill is really helpful in this period to energize your blog post.

Communication is the one of the key point in this project. Another key point is you need to work smart not work hard, setup your work priority and identify which project is critical and non-critical.

Maintain the communication along with all the team intently and if possible create the team building meeting to make sure all you team still in line with the course program objective.

  • Three days Final review program as the final benchmark before to attend the real certification exam


Lesson learned at the end the course.

If the two step above run properly, at the end of the project you need to register yourself to the certification body (AACEI) for exam. You need to register at least 1 month before the program finish, it mean when the program finish and two week after that you will continue for the exam. This is to make yourself more confident whet attending the exam and all the stuff still fresh in the memory. This will make you get chance to pass the exam at the first attempt.


  1. Selection Criteria

Hopefully this information will help the next class to success and get more benefit from this course.

  1. Analysis and Comparison of the Alternatives

–  Lesson learned before joining the course

Will be useful information to setup or preparation for the next class before join the course.

  • Lesson learned during the course

Will be useful information related the problem facing during the distance learning

  • Lesson learned at the end the course

Will be useful information before end the course


  1. Selection of the Preferred Alternatives

All the lesson learned above for better information for next class.


  1. Performance Monitoring and the Post Evaluation of Result

Here is a few lesson learned item which hopefully help the class team and next class:

  • Always work smart not hard

Check and identify what the previous class had been done, learned for them, modify and improve it, especially for blog post which can refer to them, apply their tools and technique, modify and implement it. It really possible to develop you topic blog post with the same topic with the paper topic and always structure the blog topic similar topic by topic that you’re learned. It mean one time learn could capture 3 or more project item.

  • Plan what to do and do what you plan: in here the strong commitment required to become successful of this program.
  • Suggest to select your program manager which have a strong commitment and who able to manage all the team member. Good communication within the team, able to guide and lead by example to the team.
  • Always early identify all the potential problem during the course and discuss with all the team member or get the advice from the trainer/Guru.
  • Make sure your activity in the sponsor work activity not conflict with the course program, time management is really required in this program.
  • Last but not least, one of this program objective is return on training investment. All of us need to implement all the tools and technique that we got in this course in to the real work for a better work and improvement.


References:

  1. AACE International – Professional Resources – Recommended Practices. (2014, August 23). Retrieved from http://www.aacei.org/resources/rp/
  2. Citefast automatically formats citations: APA 6th edition, MLA 7th ed. and Chicago 16th ed. (2014, August 23). Retrieved from http://www.citefast.com/
  3. Project Management World Journal — A Global Resource for Continuous Learning in Program and Project Management. (2014, August 23). Retrieved from http://pmworldjournal.net/
  1. Laksono, A. (2014), W25 Lesson Learned for Next Class, Kristal AACE 2014. Retrieved from https://kristalaace2014.wordpress.com/2014/08/23/w25_al_lesson-learned-for-next-class/
Posted in Tak Berkategori | 1 Comment

W25_WRP_Lesson Learned


1. Problem Definition

There is always room for improvement and the next project should be better than the previous one if we learn about it. In line with that, Client would like us to write what we learn from the Garuda AACE project.

2. Identify the Feasible Alternatives

There are three things that I would like to share:

1) What would I do differently if I had to take this course over again.

2) What tool/ technique I actually implement at work to help me generate a favorable Return on Training Investment (RoTI).

3) What advice I would give to others who are going to take this course in the future.

3. Development of the Outcome for Alternative

1). What would I do differently if I had to take this course again:

This course requires me to discipline the time and have a strong commitment to finish the projects. In the beginning I was very excited and want to be ahead of schedule. But as the project went by, the spirit fade away bit by bit. I think it is more because as we go to daily work, the excitement buried by another problems/ challenges/ excitement. So, it is very important to keep the spirit up. How?

2). Tool/ technique I implement at work for RoTI

I often use the economic analysis tools from Engineering Economic, together with the risk analysis.

3). Advice I would give to others who are going to take this course in the future.

As my mentor said: “Work Smart, Not hard”. You don’t have plenty of resources and don’t get burned.

4. Selection Criteria

Alternative that provides good information for the next class to complete better and get more benefit from this course.

5. Analysis and Comparison of the Alternatives

1). How to keep the spirit high as personal as well as a team member. This course requires me to discipline with the time designed and have a strong commitment to finish the projects. It is very important to be in line with team strategy and to help each other. I need to keep the communication high and make time to meet monthly. With that, we can encourage and help one another to finish the project together.  I should also beware of the holiday season and kids holiday season since it will slow my pace. Better to speed up the pace in front. Next time, I will plan my work smart, by integrating the blog, problem solving and paper assignment. Work Smart.

2). My daily routine job is more on the technical and economic evaluation. So, the Engineering Economic book is very useful in may daily job. The matters that I evaluate are also high risk. So, the risk assessment and the use of the risk analysis tools is very helpful and important, e.g. Monte Carlo, Decision Analysis Tree, and Integrated Cost and Schedule with Risk Analysis.

3) It would be beneficial to be well prepared before the class. The mentor will give the pre-read material and better we try to familiar with them and the very best practice is to ask the previous class and see the blogs posted.

For those who want to take CCP exam, you will be required to submit paper. List the topic or idea for ​​paper before class start will give you an advantage, because when the class starts you can talk directly to ask for opinions and advice of mentors, so that you can more quickly to compose paper.

In completing the blog posting assignment, see what problems you face daily and take time to learn it from course material given. There are many problems we can write in the blog, but we need to be discipline in our time.

The most important thing is to keep the spirit high by sticking in the group and the regular meeting. Regular meeting is very important to charge up, encourage and help one another in problems we faced with the assignments, as mentioned in previous paragraph.

6. Selection of the Preferred Alternatives

Those three things are very important to be informed to the next class.

7. Performance Monitoring and the Post Evaluation of Result

You are very welcome to contact Garuda Team as we will be very happy to help.

References:

  1. Laksono, A. (2014). W25_AL_Lesson Learned for Next Class | Kristal AACE 2014. Retrieved from https://kristalaace2014.wordpress.com/2014/08/23/w25_al_lesson-learned-for-next-class/
  2. AACE International – Professional Resources – Recommended Practices. (2014, August 23). Retrieved from http://www.aacei.org/resources/rp/
  3. Citefast automatically formats citations: APA 6th edition, MLA 7th ed. and Chicago 16th ed. (2014, August 23). Retrieved from http://www.citefast.com/
  4. Project Management World Journal — A Global Resource for Continuous Learning in Program and Project Management. (2014, August 23). Retrieved from http://pmworldjournal.net/
Posted in Tak Berkategori | 1 Comment

W16_WRP_Production Facility Integration for Marginal Gas Fields


1. Problem Definition

An oil and gas company discover some gas fields that not economic to be developed individually due to the amount of accumulation gas cannot satisfy the field economic. In addition, the most of the gas from those fields are with the high content of CO2 and the buyer has set the max allowable content of the CO2. Therefore, the company try to see the possibility to developed them as integrated marginal fields.

2. Identify the Feasible Alternative

There are 3 main factors and possibilities that will affect the economics of the integration:

  1. the number of fields to be integrated,
  2. the maximum plateau rate that will lead to the capacity of the facility and duration of the production, and
  3. the use of the existing nearby facility
  4. the mixing/ combination strategy of the fields to satisfy the maximum CO2 content.

3. Development of the Outcome for Alternative

The company will run 6 Major Scenarios with some sub scenario as indicated in Table-1:

Table-1. Development Scenario

Tab-1 Dev Scenario

4. Selection Criteria

The selection criteria will be on the amount of the gas can be retrieved (EUR: Estimated Ultimate Recovery), the NPV, POT, and the IRR.

5. Analysis and Comparison of the Alternative

The economics analysis of the scenarios are shown in the Table-2:

Table-2. Scenario Analysis

Tab-2 Analysis

6. Selection of the Preferred Alternative

The first priority for choosing the scenario is the EUR and the NPV. It is obvious that the Scenario 5c is the best scenario with EUR of 145 BCF and NPV of US$ 125 million.

Fig-1 Schematic Facility

Figure 1. Schematic of the Facility Integration

7. Performance Monitoring and the Post Evaluation of Result

Since the prediction of gas production from each fields and CO2 content still contain risk, the production of each field should be monitored closely and the rate of the high CO2 content field and low one, with the use of the CO2 removal, should be combined to get the sufficient CO2 content indicated by the buyer.

Reference

  1. Liana, Lita, (2013). Using AHP to Determine Appropriate MARR for Oil and Gas Projects in IndonesiaCCP Certification Technical Paper. 118130 (6), pp.13-17
  2. Garuda AACE (2015). W03_WRP_Treating or Reducing The Gas Production?. Retrieved from: https://garudaaace2015.wordpress.com/2015/03/20/w03_wrp_treating-or-reducing-the-gas-production/
  3. Garuda AACE (2015). W06.1_WRP_MRU Preliminary Economical Evaluation using NPV. Retrieved from: https://garudaaace2015.wordpress.com/2015/04/07/w06-1_wrp_mru-preliminary-economical-evaluation-using-npv/
  4. Topazsmart (2014). W5_AAA_Benefit Cost Ratio & Payback Period for Gas Development Project. Retrieved from: https://topazsmartd.wordpress.com/2014/05/26/w5_aaa_benefit-cost-ratio-payback-period-gas-development-project/


Posted in Tak Berkategori | 1 Comment

W15_WRP_Problem Focus Using Pareto Analysis


  1. Problem Definition

An oil and gas company is reviewing the problems that leading to over budget and on-stream delay. They need to do pareto analysis for lesson learned for the next big project, on what problem that they need to be more focus on.

2. Identify the Feasible Alternative

Using 20 years data during the exploitation period, they found top 10 problems that contribute to the over budget and delay of the projects. They are:

  1.  Insufficiently defined FEED
  2. Inaccurate prediction of oil and gas production profile
  3. Inaccurate cost estimates by the contractor due to inadequate FEED definition
  4. Ambiguity of the contract documents, leading to disputes over technical specification requirements
  5. Inadequate documentation to support positions and resolve issues that develop during the execution of the project or retrospectively when large claims develop at the end of the project.
  6. Multiple change orders are approved during the project or remain unresolved until the end of project
  7. Insufficient management of multiple prime contractor design and construction interfaces
  8. Owners often do not have a sufficient number of experienced personnel to manage the technical aspects of a project.
  9. Inadequate baseline schedule development and updating by contractors, leading to unreliable progress measurement, uncertain critical paths, and inability to mitigate delay.
  10. Owners do not develop a sufficient master project schedule that results from pulling together the work activities from multiple prime contractors.

3. Development of the Outcome for Alternative

A Pareto chart will be generated for analyzing what problems need first attention.

Pareto Analysis is a statistical technique in decision-making used for the selection of a limited number of tasks that produce significant overall effect. It uses the Pareto Principle (also known as the 80/20 rule) the idea that by doing 20% of the work you can generate 80% of the benefit of doing the entire job.

Here, they will identify the problems which have the greatest cumulative effect on project delays and over budget using Pareto chart as a vertical bar graph in which values are plotted in decreasing order of relative frequency from left to right.

Table 1. Top 10 problems that leading to delays and over budget in last 10 years

Table-1 Count Pareto

  1. Selection Criteria

The company prefer to focus only at 20% of the significant problems which will cover minimal 80% of the problem.

  1. Analysis and Comparison of the Alternative

Fig1 Pareto Chart

Figure 1. Pareto chart analysis

Figure 1 shows that the most problems that causing cost overrun and company shall pay attention to is insufficiently defined FEED.

  1. Selection of the Preferred Alternative

According to figure 1, the company should focus only on top 5 below complaint categories:

Table-2 Count Pareto2

If the company can handle the above top 5 problems, it means they have solved almost  80% of the overall problems.

  1. Performance Monitoring and the Post Evaluation of Result

After knowing the top 5 significant categories to focus on, the company needs to do several actions to solve the problems. Then they should monitor the result on quarterly basis whether a significant improvement has been achieved.

Reference

  1. Bassard, Michael & Riter, Diane (2010). The Memory Jogger 2nd Edition, Canada, GOAL/QPC
  2. McDonough, Michele (2012). Creating Pareto Chart with Microsoft Excel. Retrieved from: http://www.brighthubpm.com/templates-forms/8708-creating-pareto-charts-with-microsoft-excel/
  3. Laksono, Andhy (AACE Kristal 2014). W16_AL_Pareto Chart. Retrieved from: https://kristalaace2014.wordpress.com/2014/06/17/w16_al_pareto-chart/
  4. Haughey, Duncan (2014). Pareto Analysis Step by Step. Retrieved from: https://www.projectsmart.co.uk/pareto-analysis-step-by-step.php
Posted in Tak Berkategori | 1 Comment

W24_HI_Cost Estimating Method


  1. Problem Definition

Company A, a PSC Oil & Gas Company, is evaluating the development of a new gas field development. Strategic management decision in the preliminary screening stage shall be taken considering many aspects. One of the critical aspects is development cost of the gas processing plant. Since the decision shall be taken early, there is no sufficient time to conduct good and fully complete engineering study. In this stage the research is going to select qualitatively what is the most suitable cost estimation method.

  1. Development of Feasible Alternatives

AACE International identifies five classes of estimates. A Class 5 Estimate is associated with the lowest level of project definition (or project maturity), and a Class 1 Estimate is associated with the highest level of project definition.

Below matrix provides the Cost Estimate Classification for the Process Industries, including the preparation effort for each estimate class.

W24_HI_Fig 1

Figure 1. Cost Estimate Classification Matrix for the Process Industries [1]

From matrix above, in the column “METHODOLOGY Typical estimating method”, we can see several estimating method, which the selection were driven by the estimate class, level of project definition, and end usage (typical purpose of estimate).

  1. Development of the Outcomes for Alternative

Then we need to know what each method means and how those methods different with each other.

Cost estimation methodologies in general divided into two categories:

  1. Conceptual Estimating Methodologies

This method is often defined as Order of Magnitude Estimate. It is typically used for Class 5 to Class 3 AACE Cost Estimate. The method generally generated from little project definition therefore subjects to wide range estimate accuracy. Its accuracy depends on level of project definition, the quality of past historical cost data, judgments and experience of the estimator. Conceptual estimating methodologies commonly used are:

1) End-Product Units Method

This method is used if the estimator as enough historical data available from similar projects to relate the end project units (capacity units) of a project to its construction cost

2) Physical Dimensions Method

Similar with End-Product Units, this method uses the physical dimensions      (length, area, volume, etc.)

3) Capacity Factor Method

This is a factored estimation method. The cost of new equipment or facility is calculated from similar equipment or facility with known capacity. The formula is described below:

W24_HI_Fig 1a

If the capacity of facilities being factorized is relatively close in size, and if the capacity factor can represent the actual value, then this estimation can be quite accurate.

4) Ratio or Factor Method (Equipment Factor Method)

This group of methods is when the total cost of an equipment or facility can be reliably estimated from primary component cost. Several methods can be categorized as Ratio or Factor Method:

  • Lang’s Method
  • Hand’s Method
  • Miller’s Method
  • Wroth’s Method
  • Chilton’s Method

5) Parametric Method

The parametric method is the advance model of capacity and equipment factor methods. It is more sophisticated, and involves:

  • cost model scope determination,
  • data collection,
  • data normalization,
  • data analysis,
  • data application,
  • testing, and
  • documentation
  1. Deterministic (Detailed) Estimating Methodologies

In a completely detailed estimation, the following steps comprise the activities undertaken during preparation:

  • prepare project estimate basis and schedule,
  • prepare direct field cost (DFC) estimate,
  • prepare indirect field cost (IFC) estimate,
  • prepare home office cost (HOC) estimate,
  • prepare sales tax/duty estimates,
  • prepare escalation estimates,
  • prepare project fee estimate (for contractors),
  • prepare cost risk analysis/contingency determination, and
  • review/validate estimate.
  1. Selection of the Acceptable Criteria

The criteria of cost estimation selection are using the Estimate Classification from AACE International Recommended Practice No.18R-97. The criteria described below:

Table 1. Estimate Classification Criteria[2]

W24_HI_Table 1

  1. Analysis and Comparison of the Alternatives

Then, we compile the data from various department such Engineering, SubSurface, Planning, and other related department. The data availability in current stage based on the research described as follows:

Table 2. Current Development Data Register

W24_HI_Table 2

Then, from Table 2 data above, we translate them to match with Table 1-Estimate Classification Criteria, to identify belong to which class that those data are suitable.

The result of data classification criteria as per below table :

Table 3. Current Data Classification Criteria

W24_HI_Table 3

  1. Selection of the Preferred Alternative

Based Table 3 above, the nearest estimate classification suitable for this current stage of development is Class 4. We can conclude that the current project development stage is in feasibility or study stage. To do the Class 4 estimate, based on matrix in Figure 1 above, the recommended estimating method that we can use are equipments factored and/or parametric model.

  1. Performance Monitoring and Post-Evaluation of Results

After we determine the method, we can continue to do the cost estimate using the chosen method with utilizing the available data. It is also important to monitor and maintain the information or data updates such update on engineering deliverables, execution plan, master schedule, contracting strategy, etc, which could potentially impact to the level of project definition and suitable cost estimating classification criteria.


Reference:

  1. Amos, S. J. (2012). Skills & Knowledge of Cost Engineering: A Continuing Project of the AACE International Education Board (5th ed.). Section 2, Chapter 9. Morgantown, WV: AACE International.
  2. Christensen, P.et.al.(2011). AACE International Recommended Practice No. 18R-97. United States of America: AACE International.
  3. Azwar, N. (2014). W2_NA_Cost Estimation Method Selection for A Gas Processing Plant. Retrieved from https://kristalaace2014.wordpress.com/2014/03/05/w2_na_cost-estimation-method-selection-for-a-gas-processing-plant/
Posted in Tak Berkategori | 4 Comments

W25_RD_Lesson Learned (Garuda AACE 2015 Class)


Work smart not hard

  1. Problem Definition

Our Garuda Class is about to finish, with many new things and stories inside it now it times to go bring the experience to the real world. Author lesson learned;  similar with previous class lesson learned, is intended to wrap up all the activity before the 2nd Face to Face Final Review. Hopefully it could help next class to be better and run smoother.

  1. Identify the Feasible Alternative

To make it easier to be followed, then this blog will be separated into:

  1. Lesson learned of this class
  2. Tools and techniques
  3. Lesson learned before joining the course
  4. Lesson learned during the course
  1. Development of the Outcome for Alternative

This course is designed to develop competency in applied asset, portfolio, program and project management tools, techniques and methodology for practitioners, generating a measurable, favorable return on training investment, for both the professional practitioner and for the organization that sponsors them.

Lesson learned of this class

Some lesson learned for this in order to running smoother are:

  • Commitment and Teamwork

Team member commitment and teamwork should be maintain from the beginning to the end.

  • Knowledge implementation.

Even though task distribution had been on day 1, however each team member should be able to back up their team mate. Since most of the topic will relate to Project Control area, then each team member should be able to understand it. Class Weekly report is an excellent case study on how it implement.

  • Consistency

Easy to say but hard to implement. Our class finally realize it at the middle, and surprisingly it help us to improve the progress significantly.

Tools and techniques

Two books will be a main reference of this class plus 1 very useful booklet of Tools and Techniques:

  1. Project Management Using Earned Value by Humphrey
  2. Engineering Economics by Sullivan
  3. The Memory Jogger by Brassard and Ritter

From these reference we could utilize several tools and technique directly in our daily work activitiy such as:

  1. Ideas and Decision Making

Fishbone, Radar Chart and Prioritization, Nominal Group Technique (NGT), Force Field,

  1. Historical Data, Estimating, Project Control , Project Risk, and Forecasting

Pareto, control charts, Delphi technique, WBS, EVM PERT, CPM, float analysis, learning curve

  1. Engineering Economics

WACC, MARR, Financial Profitability Analaysis

 Lesson learned before joining the course

  • Commitment and Teamwork

One thing that everybody should be aware before joining this class is everybody should have a strong commitment. Not only because the timeline, but also because there will be many obstacle either come from internal or from the external. Therefore to anticipate it, find information as many as possible from the previous classes, especially information related blogs, paper, weekly report, citation including tips and trick to make your life easier.

  • Topic Laundry List

Creating a laundry list of paper and blog topic before the class will be a great advantage.

Lesson learned during the course

  • 1st Phase: 1st face-to-face session.

In this opening session, everybody should be agreed on several critical items such as project organization, schedule, rule, communication channel, change order management and conflict resolution.

Imagine this class is the Project, right person on the right position will be a key. Therefore everybody should actively contribute in the limited timeline. Any problem in this stage potentially will suffering overall team, slowly but sure it will create conflict. Another thing need to be kept in mind is that this class is not a “Beauty Contest”, this is a Project. Therefore, besides increasing your knowledge, solid teamwork to finish this class is definitely required.

  • 2nd Phase : Long distance learning method

This phase team commitment is tested. Team leader should be able to arrange his/her colleagues effectively. Do not hesitate to ask questions or ask for help when facing difficulties. “Work Smart not Hard”, you may hear it a lot during this class, this pledge can help you many time especially during the hard time. To save your time, do not reinvent the wheel, unless it really necessary by some reason.

Especially for the Leader, when the time come he/she have to be able to take a big decision especially when dealing with low performing member. Any decision has its own consequences where all member should respect and support it.

From the typical total 7 task, below 3 are the main task that need a special intention in order to keep the progress running well:

  • Weekly Report

Sound simple since it just a reporting, However how to intepret the result, maintain the logic and accuracy that meet Client requirement are the other things need to be handled carefully.

  • Paper Project

Start from W1, focus on this task. Great advantage if each team member could bring their Paper topic at the first Face to Face session so it can be discussed properly to avoid delay in submitting the Paper topic. Try to finish it within the timeline, because we cannot predict what our individual future workload will be.

  • Blog Project

Idea can be obtained from the daily work, daily life, class, AACE recommended practice, papers (PM World Journal, AACE, etc.), also the ideas of the previous class. Much better if the list can have a link between one and another. For example, Subcontracting can be elaborated into many blog topics depend how we look at it such as user requirement, selection, financial, project control, and contracting strategy. Try to publish more blog in front as a buffer. This way, you will have a spare just in case you need it someday.

Other task such as problem solving and mapping tools more like task to help you understanding the theory in books and preparation for the exam. However even though these task are scheduled at the middle to the end of the class, do not under estimate it since it potentially could delay the progress if it not maintain well.

Last task before 2nd Face to Face review is the Bid Project. Once again, team member should be proactive in order to finish this assignment.

Note :

  1. If you could link the blog, paper and problem solving. Prior to Client agreement, if you do this you could claim multi progress.
  2. Reference should be valid and should follow APA format. Citefast could be utilize for this purpose
  3. Refer to the other blog is not a taboo, however please respect the original author by not being a pure copycat and put related link in the citation. At the end, all these blogs that we produced are to help us understand how to use tools and technique in our daily work.

Below are related links for the information as mention above:

  1. PM World Journal          : http://pmworldjournal.net/
  2. AACE                                 : http://www.aacei.org/
  3. 2012 Class                         : https://aacecasablanca.wordpress.com/
  4. 2013 Class                         : https://mercureaace2013.wordpress.com/
  5. 2014 Class                         : https://kristalaace2014.wordpress.com/
  6. 2015 Class                         : https://garudaaace2015.wordpress.com/
  7. Citefast                              : http://www.citefast.com/
  1. Selection Criteria

Any usefull information from above description could be utilize.

  1. Analysis of the Alternatives

Above Lesson learned could be utilize to improve not only for this class team member but also for the future class in order to gain efficient and smooth progress.

  1. Selection of the Preferred Alternatives

Depending on the class phase, above lesson learned could be utilized.

  1. Performance Monitoring and the Post Evaluation of Result

Since goals of this class not only to pass one of the AACE certification at the 1st attempt but also include Return on Training Investment (RoTI), especially for those who are funded by their institution then please be active and implement of what you will learn from this class to your daily work effectively. Good luck and have a wonderful journey with your class.

References:

  1. AACE International – Professional Resources – Recommended Practices. (2014, August 23). Retrieved from http://www.aacei.org/resources/rp/
  2. Citefast automatically formats citations: APA 6th edition, MLA 7th ed. and Chicago 16th ed. (2014, August 23). Retrieved from http://www.citefast.com/
  3. Project Management World Journal — A Global Resource for Continuous Learning in Program and Project Management. (2014, August 23). Retrieved fromhttp://pmworldjournal.net/
  4. Laksono, A. (2014). W25_AL_Lesson Learned for Next Class | Kristal AACE 2014. Retrieved from https://kristalaace2014.wordpress.com/2014/08/23/w25_al_lesson-learned-for-next-class/
Posted in Tak Berkategori | 2 Comments

W25_HMIP_Earned Value Management Probabilistic Forecasting using Monte Carlo Simulation of Project A in PT ABC.


1. Problem Definition

Continue from Blog W21 after choosing Project A using Monte Carlo Simulation. Project Manager of PT ABC were requested by CEO to Earned Value Management calculation using Monte Carlo simulation of Project A in order to more comprehend of project cost and schedule risk analysis.

Schedule risk has typically impact the duration of project. The probability of duration will impact on Planned Value/ BCWS. Earned Value can be defined as the evaluation between what was obtained ac­cording to what was truly spent and to what was planned to be spent, in which it is suggested that the value to be earned initially by an activity is the value bud­geted for this activity. As each activity or task of a project is accomplished, that value initially budgeted for the activity, now builds the Earned Value of the proj­ect.

Integrated cost and schedule risk analysis using Monte Carlo Simulation has been explained in W24 blog posting [2]. This W25 blog posting will address the Earned Value Probabilistic Forecasting using Monte Carlo Simulation.

2. Identify the Feasible Alternative

HARROFF (2000) and FLEMING & KOPPELMAN (1999) subdivide the measure­ment of Earned Value (BCWP) in different methods:

a. Milestone with weighted value: The control cell is converted in 2 or more marks where each one of them is defined by a partial delivery of the work, generating, consequently, a specific cost. The sum of the costs of accomplishment of each one of these marks is the cost of the item.

b. Fixed formula by CAP: It is the method that divides CAP in 2 parts that, if summed up, complete 100% of the work. In general, the most used formulas are 25/75, 50/50 and 75/25. The formula 25/75 separates the work in 2 points: the first point is accomplished immediately at the beginning of CAP (25% of costs are already accounted); the other 74% are accounted when the work is finished. The formula 50/50 points out that 50% of costs will be accounted at the beginning of the work and 50% at the end.

c. Percent complete: This method attributes to each element of a certain percent complete (between 0 and 100%) to each control cycle. This percentage is multiplied by the forecasted cost, aiming to determine the part of the budget already done.

d. Equivalent units: It is a method that calculates the Earned Value based on the units produced or made by individual elements of costs, applied in repetitive works or where the elements are defined in terms of direct consumption of resources.

It is common sense in all Earned Value reports that there is not only one method able to fulfill all kinds of work. Most of the times, companies should allow the use of more than a mechanism of Earned Value calculation.

Figure 1 : Earned Value Project Management: The Process

Figure 1 : Earned Value Project Management: The Process

3. Development of the outcome for Alternatives

Earned Value management (EVM) contains some terms below:

  • Schedule Variance (SV)
  • Cost Variance (CV)
  • Schedule Performance Index (SPI)
  • Cost performance Index (CPI)
  • Estimate at completion (EAC)
  • Estimate to complete (ETC
  • Variance at completion (VAC)

In this case, the first four parameter (SPI, CPI, SV & CV) above will be used to know that the project is in a good or bad conditions and helps the project manager to find the next action to get the project finished on time.

Earned Value Management (EVM) is a project management control technique which effectively integrates actual accomplishment in terms of cost, schedule, and scope. However, EVM as a management approach should be supplemented with additional measures and metrics during the monitoring and controlling phase to attain a more comprehensive understanding of current performance and to help management make well-informed decisions. These additional measures and metrics can provide valuable predictive indicators that can be used to develop and implement effective mitigation plans. These other measures and metrics that a program manager can utilize during the monitoring and controlling phase to ascertain the current performance, include:

  • Risks and Opportunities vs. Management Reserve
  • Technical Performance Measures (TPMs)
  • Supplier Late Starts vs. Planned Starts
  • Staffing Needs vs. Available Resources.

The main tool of analysis is a Monte Carlo simulation of the cost‐loaded schedule. Monte Carlo simulation is standard practice in quantitative schedule and cost risk applications. Most software packages that simulate project schedules can be used to integrate cost and schedule risk in the same simulations, although some packages are more capable than others. Other software applications may be developed in this new field of integrated risk analysis.

4. Selection of Criteria

Mr B. use Monte Carlo simulation to conduct earned value probabilistic forecasting

For complicated problems, Monte Carlo simulation generates random outcomes for probabilistic factors so as to imitate the randomness inherent in the original problem.

Figure 2 : Project S-Curve

Figure 2 : Project S-Curve

The term and formula in Earned Value Management (projects valuation) is shown below :

Figure 3 : EVMS Terms and Formula

Figure 3 : EVMS Terms and Formula

Figure 4 contains information of load sources based schedule.

Figure 4 : Project Base Schedule Information

Figure 4 : Project Base Schedule Information

Critical Path Method Schedule :

Figure 5 : Project Network Diagram

Figure 5 : Project Network Diagram

As shown in Figure 5, the Project duration is 21 months, with the critical path is activities ADFG. Beside critical path, there are three other paths, namely ABG, ACEG and ADEG.

Mr B also Identified assumption BAC, Duration, % Duration, % Complete, ACWP :

Figure 6 : Percentage of Duration, Percentage of Complete and ACWP calculation using Monte Carlo Simulation.

Figure 6 : Percentage of Duration, Percentage of Complete and ACWP calculation using Monte Carlo Simulation.

5. Analysis and Comparison of the Alternatives

Mr B. use Monte Carlo simulation to calculate Earned Value Probabilistic Forecasting

Figure 7 contain result of Monte Carlo simulation for EVMS Calculation Probabilistic Forecasting :

Figure 7 : EVMS Calculation Probabilistic Forecasting

Figure 7 : EVMS Calculation Probabilistic Forecasting

Figure 8 contains comparison of each EVMS criteria using Monte Carlo Simulation :

Figure 8 : EVMS criteria using Monte Carlo Simulation

Figure 8 : EVMS criteria using Monte Carlo Simulation

6. Selection of the Preferred Alternative

First, Project Manager get Project Objectives from CEO as an Asset Manager :

Figure 9: The Strategic Asset Management Process Map

Figure 9: The Strategic Asset Management Process Map

Second, Mr B. calculate a probability BAC, Duration, % Duration, % Complete, ACWP for Min, Most Likely and Max.

Percent Complete calculation

Duration monte carlo calculationThird, Mr. B calculate and compare Monte Carlo Simulation Analysis using 1000 trial for each EVMS criteria using Monte Carlo Simulation :

Monte Carlo calculation

By using management desired probability of P90, each EVMS criteria are obtained, as shown in Figure 10.

Figure 10 : P90 EVM Probability Forecasting

Figure 10 : P90 EVM Probability Forecasting

From Figure 8,Mr B. decided to use desired probability of P90 for EVMS Probability Forecasting.

7. Performance Monitoring and the Post Evaluation of Result

The use of Simulation Monte Carlo with the data of final EAC of the project, can, in an associated way, contribute to a probabilistic vision and not a deterministic vision of the final costs elaborated for the project, without the additional effort in its construction.

As mentioned in the study of CHRISTENSEN (1993), there isn’t an agreement in order to define which forecast model presents the best precision and applicabili­ty. However, many studies have been made in order to compare many models for the costs estimated in a certain project or group of projects, after its conclusion, aiming to identify which models are more precise and in which phases of the project they are applicable, as well as to associate a certain type of project to a certain index.

The need of estimates and costs projections is mentioned and characterized by DOD (1997) in Instruction 5000.2R in 1997 in 2 criterion.

Start with an estimate area for the final cost, reflecting the best and worst scenar­ios.(DOD, 1997).

Determine the estimate for the final cost that reflects the best professional judg­ment concerning costs. If the contract is at least 15% complete and the estimate is less than the calculated using the accumulated performance index, give an explanation (DOD, 1997).

However, none of these studies provides a probabilistic treatment for the proj­ects, since the most adequate final EAC for the project is no longer an isolated value and turns out to be a values area with certain probabilities, as suggested in this article.

As a suggestion for new works, the next step will be to evaluate the results pro­duced in the simulation with the real results of concluded projects in order to determine the precision of data obtained, aiming to produce cases associated to the simulation model applied to EVMS.

References :

  1. AACE (2011).Total Cost Management Framework: An Integrated Approach to Portfolio, Program, and Project Management. Chapter 2 Page 24.
  2. Humphreys, G.C. (2011). Project Management Using Earned Value, Chapter 17, page 325 to 346, Second Edition, Humphreys & Associates, Management Consultants.
  3. Wain Y.A. (2014). W23_YAW_Integrated Cost and Schedule Risk Analysis (2) Retrieved from https://kristalaace2014.wordpress.com/2014/07/30/w23_yaw_integrated-cost-and-schedule-risk-analysis-2/#more-2114
  4. Vargas, Ricardo (2004). EARNED VALUE PROBABILISTIC FORECASTING USING MONTE CARLO SIMULATION Retrieved from http://www.slideshare.net/ricardo.vargas/earned-value-probabilistic-forecasting-using-monte-carlo-simulation?from_action=save
  5. AACE International (2015). Recommended Practice No. 57R‐09: Integrated Cost and Schedule Risk Analysis Using Monte Carlo Simulation of a CPM Model. Retrieved from http://www.aacei.org/avectramembers/rps/57R-09.pdf
Posted in Tak Berkategori | 1 Comment

W23_HI_Analytic Hierarchy Process


  1. Problem Definition

In this blog, I would like to analyze the same case study as in my previous W3 Blog, bid evaluation, using Analytic Hierarchy Process (AHP), and comparing the result.

  1. Development of Feasible Alternatives

Based on W3 Blog, the four proposals that will be evaluated using Analytic Hierarchy Process, are as per table below:

Table 1. Summary of Proposal Attributes Comparison

 W23_HI_Table 1

  1. Development of the Outcomes for Alternative

Using AHP, in complex decision, costs (price) should be set aside until the benefits of the alternatives are evaluated.

Therefore, the information above is arranged in a hierarchical tree as below:

W23_HI_Fig 1

Figure 1. The Hierarchical Tree of Supplier Selection

  1. Selection of the Acceptable Criteria

Then, we perform pairwise comparison.

Table 2. The Fundamental Scale of Absolute Number [1]

W23_HI_Table 2

Pairwise comparison matrix as per below :

Table 3. Pairwise Comparison Matrix

W23_HI_Table 3

Then using decimal, the matrix as per below :

Table 4. Pairwise Comparison Matrix using Decimal

W23_HI_Table 4

Normalized matrix of paired comparisons and calculation of priority weights (eigenvalue).

Table 5. Normalized Matrix Iteration 1 and 2

W23_HI_Table 5

The delta of two iterations above are very small, so we stop only until iteration 2.

The consistency ratio (C.R.) for the comparison above is calculated to determine the acceptance of the priority weighting.

Based on Saaty’s empirical suggestion that a C.R. = 0.10 is acceptable.

To do that, we need Principal Eigen value that obtained from the summation of products between each element of Eigen value and the sum of columns of the reciprocal matrix.

Using sum column from Table 4 and eigen value of iteration 2 from Table 5, the calculation is as per below :

W23_HI_Fig 1a

Table 6. Random Consistency Index Table

W23_HI_Table 6

Random Consistency (RI) for size of matrix 4 = 0.90

CR= CI/RI = 0.0230 / 0.90 = 0.0256 < 0.1 ,  acceptable.

  1. Analysis and Comparison of the Alternatives

We do the same procedures for alternatives and the results are below:

Table 7. Normalized Score for Alternative

W23_HI_Table 7

The alternative ranking is the product between alternative ranking matrix and criteria ranking.

W23_HI_Fig 2

Figure 2. Alternative Ranking Calculation

Alternative that having highest weights will be selected. R is the highest ranked supplier.

  1. Selection of the Preferred Alternative

After alternative ranking has been defined, we have to compare between benefits and costs (price) using benefit – cost ratio.

Table 8. Normalized Cost and Benefit-Cost Ratio

W23_HI_Table 8

Based on benefit – cost analysis, Supplier R has highest ratio.

  1. Performance Monitoring and Post-Evaluation of Results

The result is same with the result of the multi attributes compensatory models using Additive Weighting Technique as per Author’s W3 Blog. In order to have more accurate result, pairwise comparison matrix can be done by surveying the experts or anyone who has good understanding of the problems.

Reference:

  1. Saaty, T. L. (2008). Decision making with the analytic hierarchy process. Int. J. Services Sciences.
  2. Haas, R., & Meixner, O. (2014). An Illustrated Guide to the Analytic Hierarchy Process. Retrieved from: https://mi.boku.ac.at/ahp/ahptutorial.pdf
  3. Laksono, A. (2014). W12_AL_Vendor Evaluation. Retrieved from https://kristalaace2014.wordpress.com/2014/05/14/w12_al_vendor-evaluation/
  4. Wijanarka, W. (2015). W5_WW_ Analytical Hierarchy Process. Retrieved from https://garudaaace2015.wordpress.com/2015/03/28/w5_ww_-analytical-hierarchy-process-2/
  5. Irawan, H. (2015). W3_HI_ Decision Making Considering Multi-Attributes . Retrieved from https://garudaaace2015.wordpress.com/2015/03/10/w3_hi_decision-making-considering-multi-attributes/
Posted in Tak Berkategori | 2 Comments

W24_EY_Estimate Project Contingency Using Range Estimating for Project XYZ


  1. Problem Definition

After finishing Class 4 cost estimate for Floating Production Facility, project XYZ, as per procedure and estimating process, estimator required to develop cost risk and contingency analysis. In this case Author will do the contingency analysis using range Estimating.


  1. Development of Feasible Alternatives.

One of the critical part in the estimating cost development cost is to determine what is the contingency should be allocate in the cost estimate to minimize cost overrun. To do this assessment there are 4 methods to estimate cost (also time) contingency, i.e. [1]:

  • Expert Judgment
  • Predetermined Guidelines (with varying degrees of judgment and empiricism used)
  • Simulation Analysis (primarily expert judgment incorporated in a simulation)
  • Range Estimating
  • Expected Value
  • Parametric Modeling (empirically-based algorithm, usually derived through regression analysis, with varying degrees of judgment used)

Based on above method, in this case Author will do the simulation analysis using range of estimating approach.

Range estimating is a risk analysis technology that combines Monte Carlo sampling, a focus on the few critical items, and heuristics (rules of thumb) to rank critical risks and opportunities [4]. This approach is used to establish the range of the total project estimate and to define how contingency should be allocated [2].

The following steps will be used to determine cost contingency using range estimating:

  • Determines of ranges for each cost items.
  • Determines the probability that each item can be completed within the estimate.
  • Running Monte Carlo simulation for the cost range.
  • Determines of critical items based on result of Monte Carlo simulation.
  • Determine of contingency with reference to critical items only.


  1. Development of the Outcomes for Alternative

Based on cost estimate that already finished before, the following are the base cost estimate for Floating Production Facility, Project XYZ:

W24 EY tab1

Table 1. Floating Production Project Base Estimate

Even though the risk analysis and based on historical information, range of each cost items was determined by project team as shown on table 2. Below. There is a disired probability provided by management team as per company guide line and team expertise.

W24 EY tab2

Table 2. Range and Desired Probability of Cost Items

Based on internal guideline, Author need to determine the probability cost at P10, P50, and P80.

Based on above info and requirement, the following step is to conduct Monte Carlo simulation with result as the following:

W24 EY tab3

Table 3. Result of Monte Carlo Simulation


  1. Selection of the Acceptable Criteria.

Determines of critical items are conducted by using the following criteria.

W24 EY tab4

Table 4. Criteria for Determine of Critical Items [3]

The contingency and range of probability will be determine at P10, P50 and P80


  1. Analysis and Comparison of the Alternatives.

With refer to table 4 above and internal project team requirement, we can determine the critical items for each probability as shown in Table 5 below. Where the red color marked as critical item.

W24 EY tab5

Table 5. Determines of Critical Items


  1. Selection of the Preferred Alternative

Based on assessment on the data provided above, we can determine the critical item and the contingency allocate on it. In this method, only the critical item will use to generate the contingency.

W24 EY tab6

Table 6. Contingency Determination Result

The result of contingency are as the following:

At P10 = USD (205,099,000) (or -11% from Base Case)

At P50 = USD 16,950,000 (or +0.7% from Base Case)

At P80 = USD 217,347,000 (or +10% from Base Case)


  1. Performance Monitoring and Post-Evaluation of Results

Since this is class 4 estimate, there is still have a wide range of accuracy depend on project definition. The risk and contingency management should to developing and need monitoring closely. Risk register and contingency determine on each class of estimate should be conduct with other method and compare it.


Reference:

  1. AACE International. (2008). Recommended Practice No. 40R-08, Contingency Estimating – General Principles, page 3 – 4, AACE International. Morgantown, WV.
  2. AACE International. (2008). Recommended Practice No. 41R-08, Risk Analysis and Contingency Determination Using Range Estimating, page 1, AACE International. Morgantown, WV.
  3. Ibid 2, page 2.
  4. Wain Y.A. (2014). W20_YAW_Contingency Estimation in Storage Tank Project (1), retrieved from: https://kristalaace2014.wordpress.com/2014/07/07/w20_yaw_contingency-estimation-in-storage-tank-project/
Posted in Tak Berkategori | 3 Comments